What tools do white-label providers use for proactive IT monitoring?
White-label providers use a variety of proactive IT monitoring tools to ensure the health, performance, and security of client systems. These tools provide real-time insights, automate issue detection, and enable swift resolution to minimize downtime and disruptions.
Common tools used by white-label providers for proactive IT monitoring
1. Remote Monitoring and Management (RMM) Tools
- Examples: ConnectWise Automate, Datto RMM, NinjaOne.
- Features:
- Continuous monitoring of devices, servers, and applications.
- Automated patch management and software updates.
- Real-time alerts for hardware and software issues.
2. Network Monitoring Tools
- Examples: SolarWinds, PRTG Network Monitor, Nagios.
- Features:
- Tracks network performance metrics like latency, bandwidth, and packet loss.
- Identifies potential bottlenecks and prevents network outages.
- Monitors critical devices like routers, switches, and firewalls.
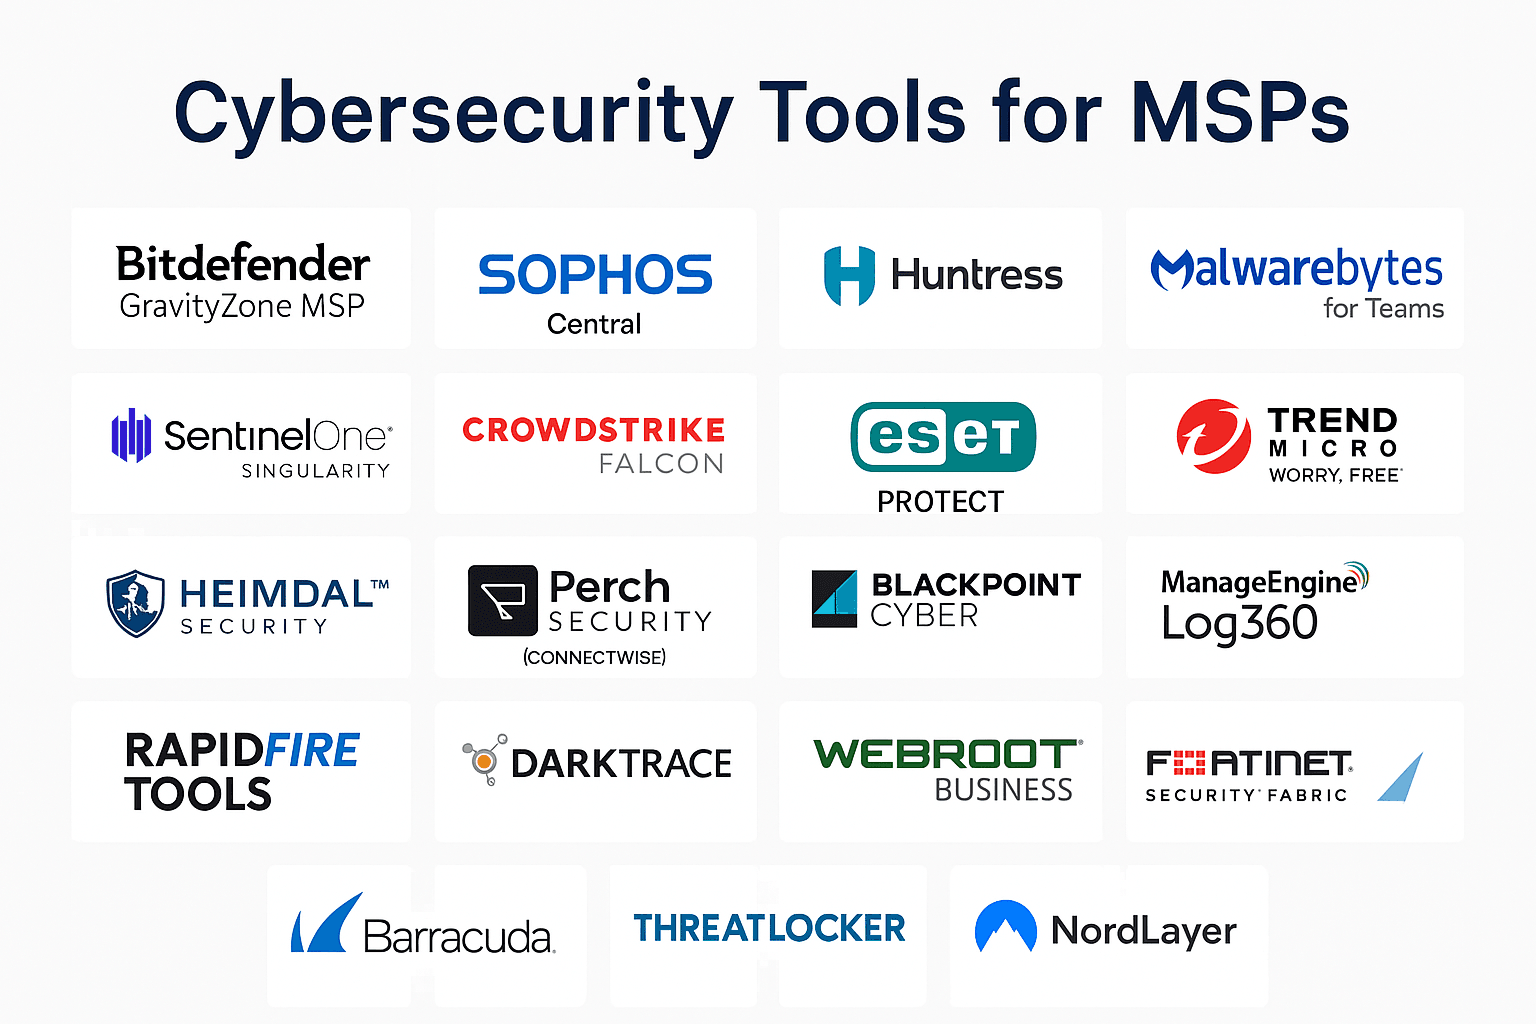
3. Security Information and Event Management (SIEM) Tools
- Examples: Splunk, LogRhythm, AlienVault.
- Features:
- Aggregates and analyzes security event data from multiple sources.
- Detects and alerts on suspicious activities or potential threats.
- Provides compliance reporting for regulations like GDPR, HIPAA, or PCI DSS.
4. Endpoint Detection and Response (EDR) Tools
- Examples: CrowdStrike, SentinelOne, Microsoft Defender.
- Features:
- Monitors endpoint devices for malicious activity.
- Provides real-time threat detection and automated response capabilities.
- Tracks endpoint performance to ensure system stability.
5. Application Performance Monitoring (APM) Tools
- Examples: New Relic, AppDynamics, Dynatrace.
- Features:
- Tracks application performance metrics, such as response times and error rates.
- Detects issues affecting end-user experience.
- Monitors dependencies like databases and APIs.
6. Cloud Monitoring Tools
- Examples: AWS CloudWatch, Azure Monitor, Google Cloud Operations Suite.
- Features:
- Monitors cloud infrastructure, services, and applications.
- Provides insights into resource utilization and cost optimization.
- Detects anomalies in cloud environments to ensure high availability.
7. Backup and Disaster Recovery Monitoring Tools
- Examples: Veeam, Acronis, Barracuda.
- Features:
- Monitors backup processes to ensure successful data protection.
- Alerts for failed backups or missed schedules.
- Tracks recovery time objectives (RTO) and recovery point objectives (RPO).
8. Log Management Tools
- Examples: ELK Stack (Elasticsearch, Logstash, Kibana), Graylog, Papertrail.
- Features:
- Collects and analyzes system logs for anomalies or errors.
- Provides detailed insights into system activity and performance.
- Facilitates root cause analysis for faster issue resolution.
Benefits of proactive IT monitoring tools for MSPs
- Improved uptime: Early detection and resolution of potential issues prevent service disruptions.
- Enhanced security: Identifies vulnerabilities and mitigates threats before they escalate.
- Operational efficiency: Automates routine tasks, freeing up resources for strategic initiatives.
- Client satisfaction: Ensures consistent performance and reliability for client systems.
Looking for white-label providers with cutting-edge IT monitoring tools?
Medha Cloud partners with trusted providers to deliver proactive monitoring solutions tailored to your business needs.
Protect your organization with expert healthcare IT support designed for HIPAA compliance.
Secure Healthcare IT ManagementTopics
Bharath Kumar
Senior Microsoft 365 Consultant • 8+ years
Bharath is a Senior Microsoft 365 Consultant specializing in enterprise productivity solutions and white-label IT services. He has successfully deployed Microsoft 365 for over 200 organizations and helps MSPs build scalable white-label partnerships.
More in White Label MSP
View all
NinjaOne Alternatives — 7 RMMs Compared by an MSP That Runs Them (2026)
9 min read

SentinelOne Pricing — Singularity Tiers Per Endpoint, MSP Rates & CrowdStrike Math (2026)
7 min read
NinjaOne Pricing — What You'll Actually Pay Per Endpoint (MSP Operator Breakdown, 2026)
8 min read
55 Managed Services Market Statistics for 2026 — MSP Growth Data
20 min read
MSP Industry Statistics 2026: Market Size, Growth & M&A Data
16 min read
Kaseya Fires 250 People After 'Very Strong' 2025 — What MSPs Should Know
9 min read